


.png)
Reporting & Analytics
See Your Stats While They’re Hot
Sales, attendance, campaigns, revenue — Flicket's reporting pulls every signal from your event into one live view, so the decisions you make on the fly.



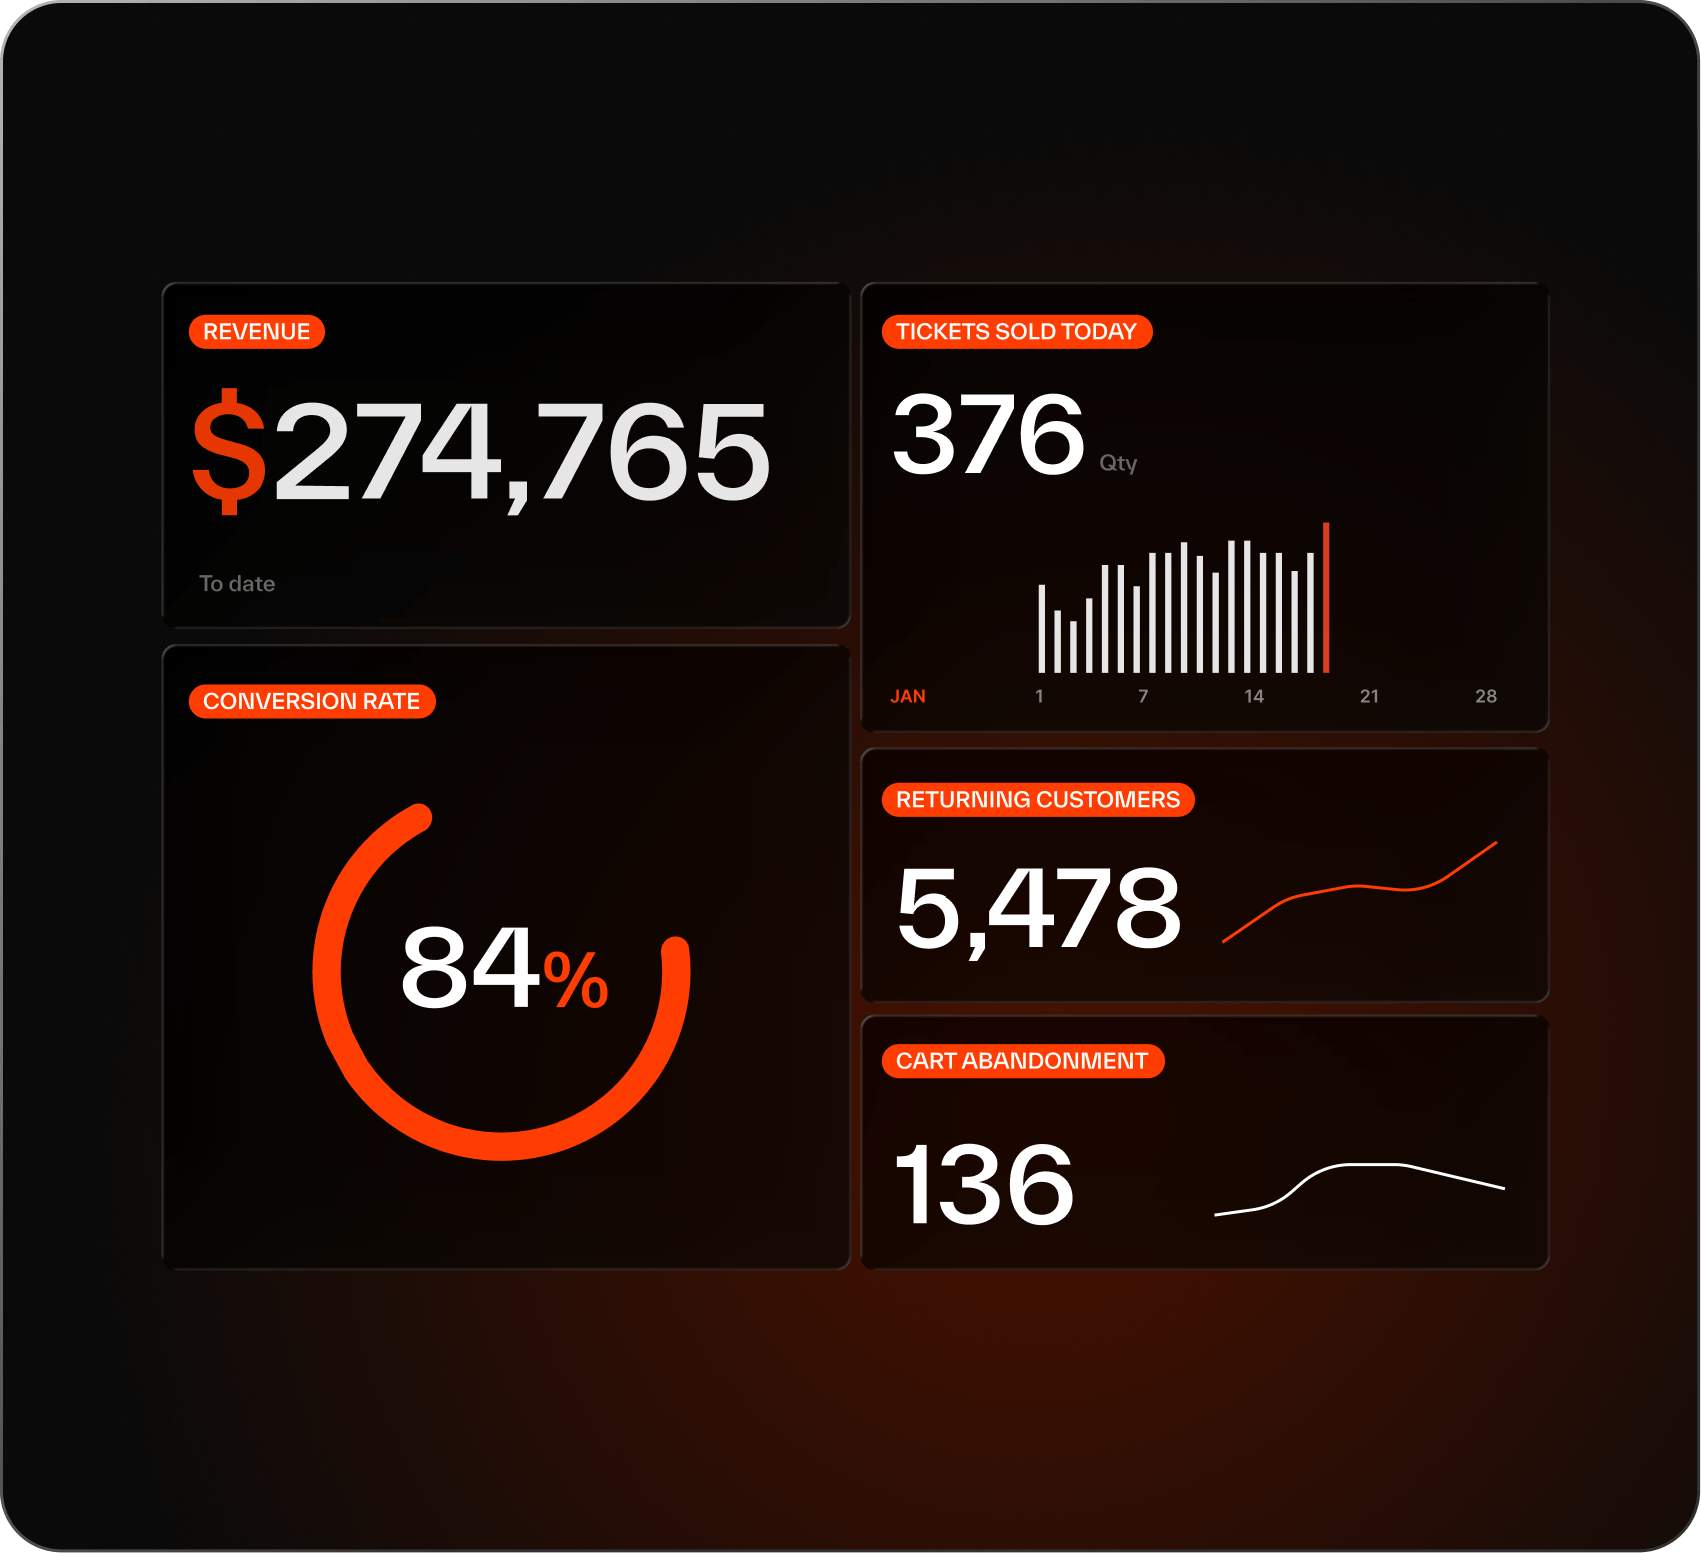
Every number in full view.
See Your Event Performance
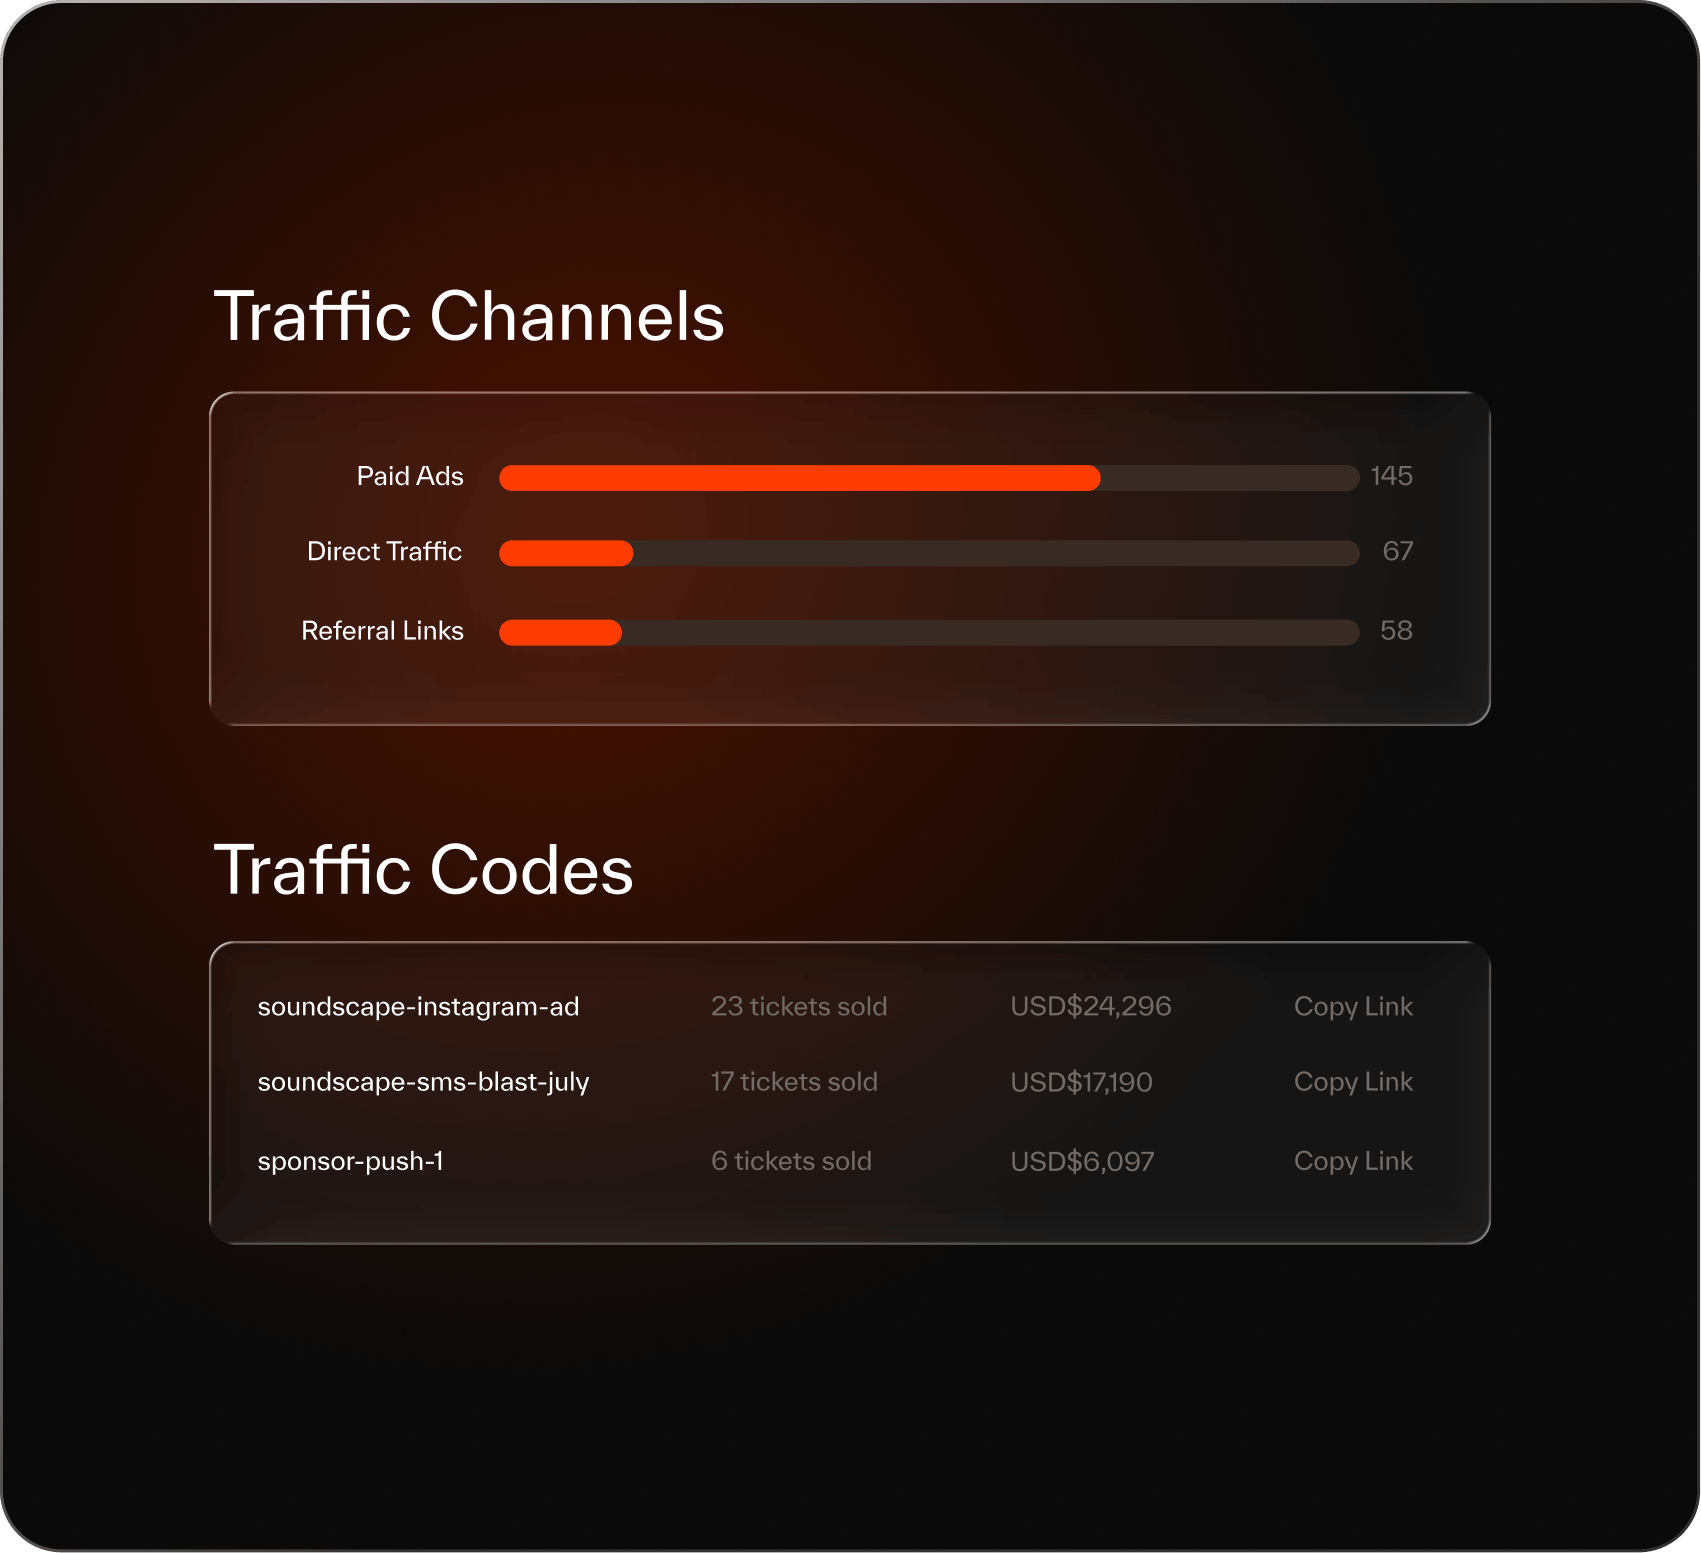
See what drove the sale.
End-to-End Attribution
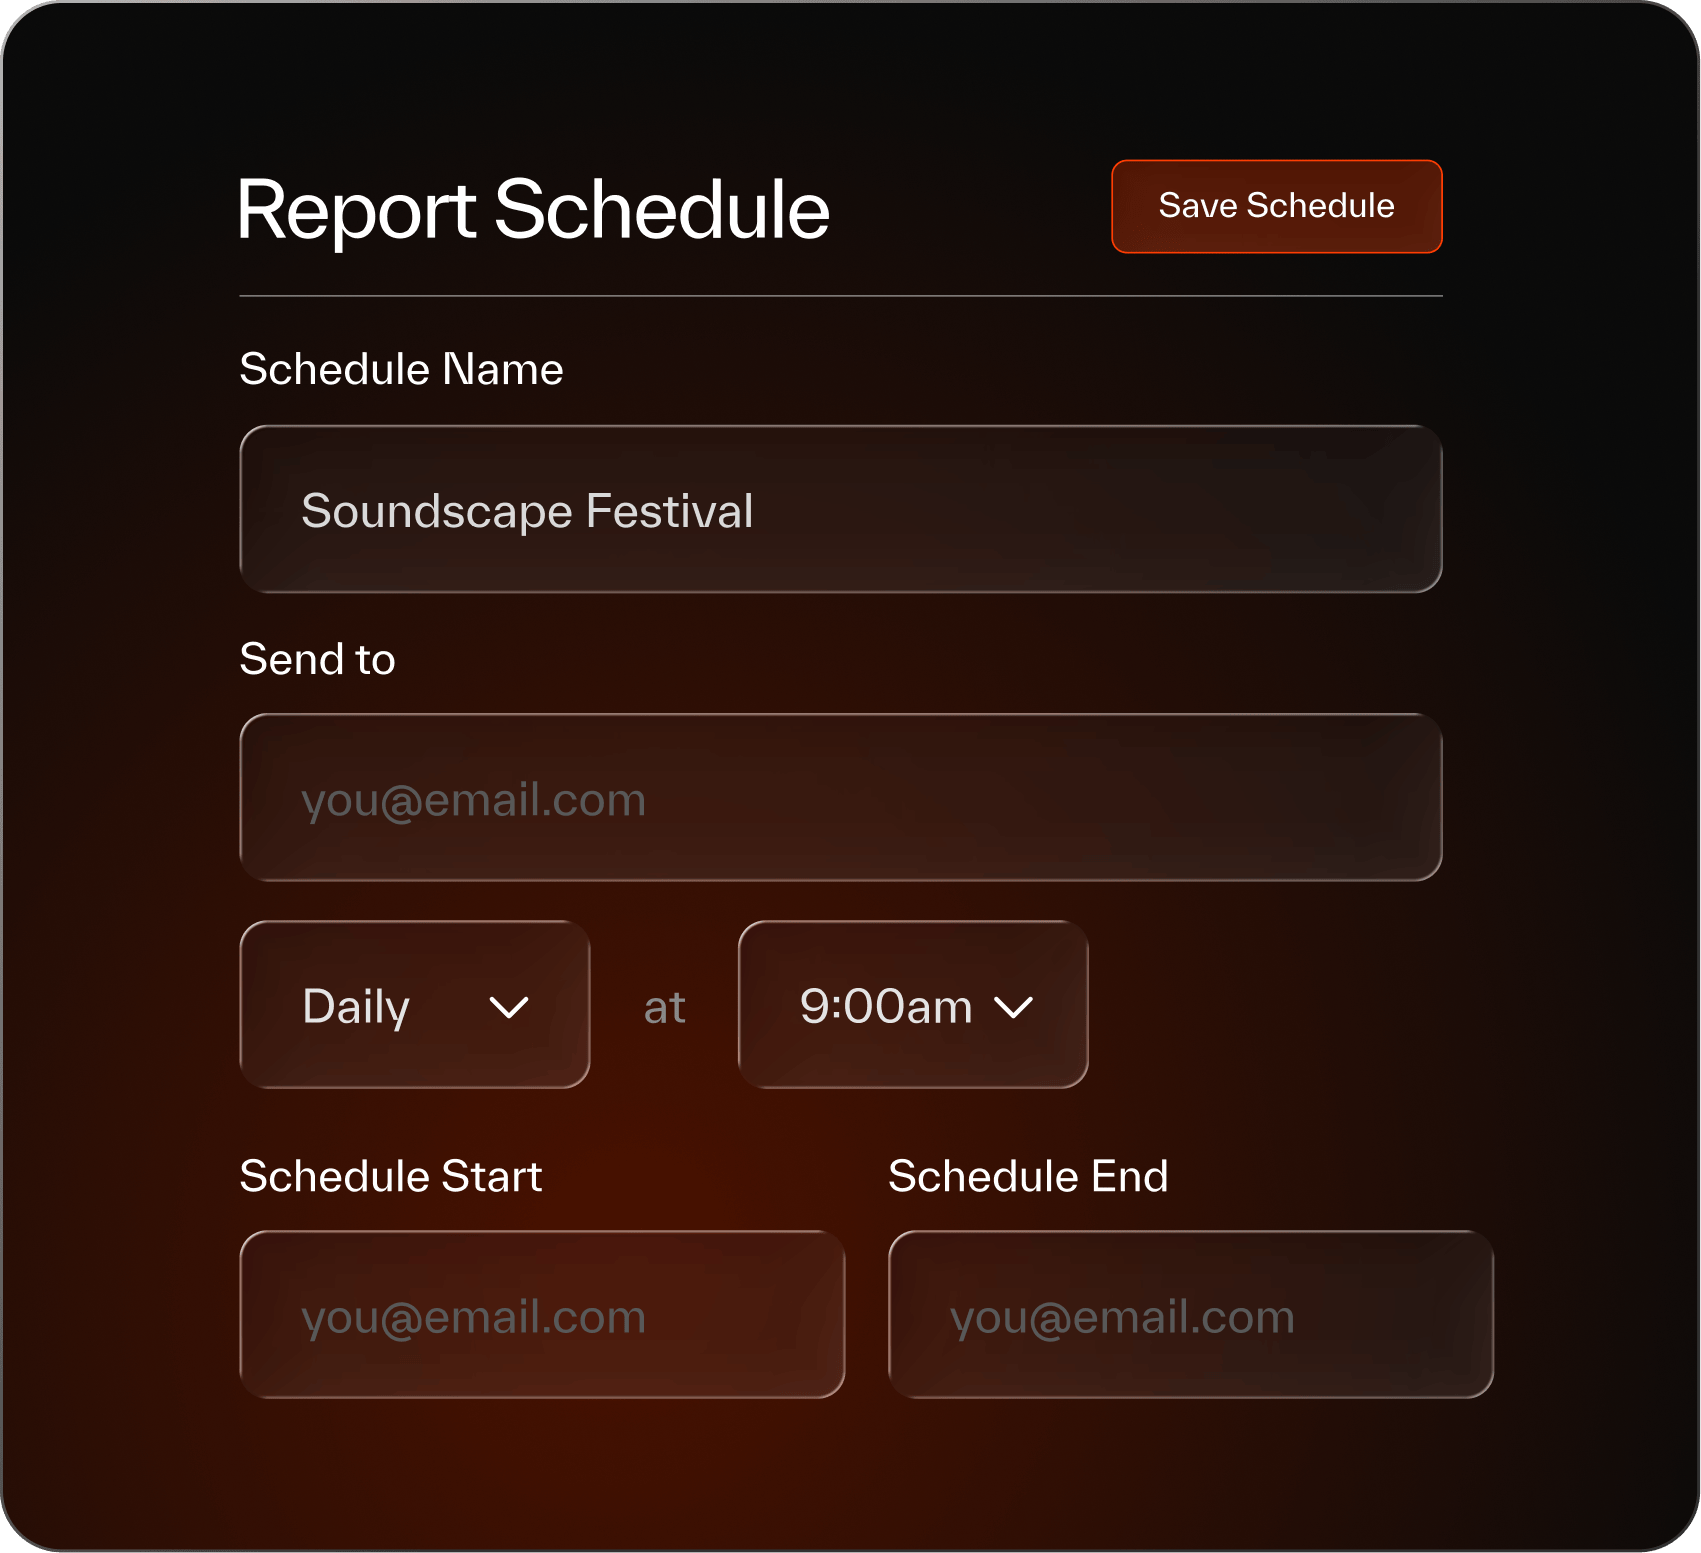
The answers, already waiting.
Scheduled Reports
Know what good looks like.
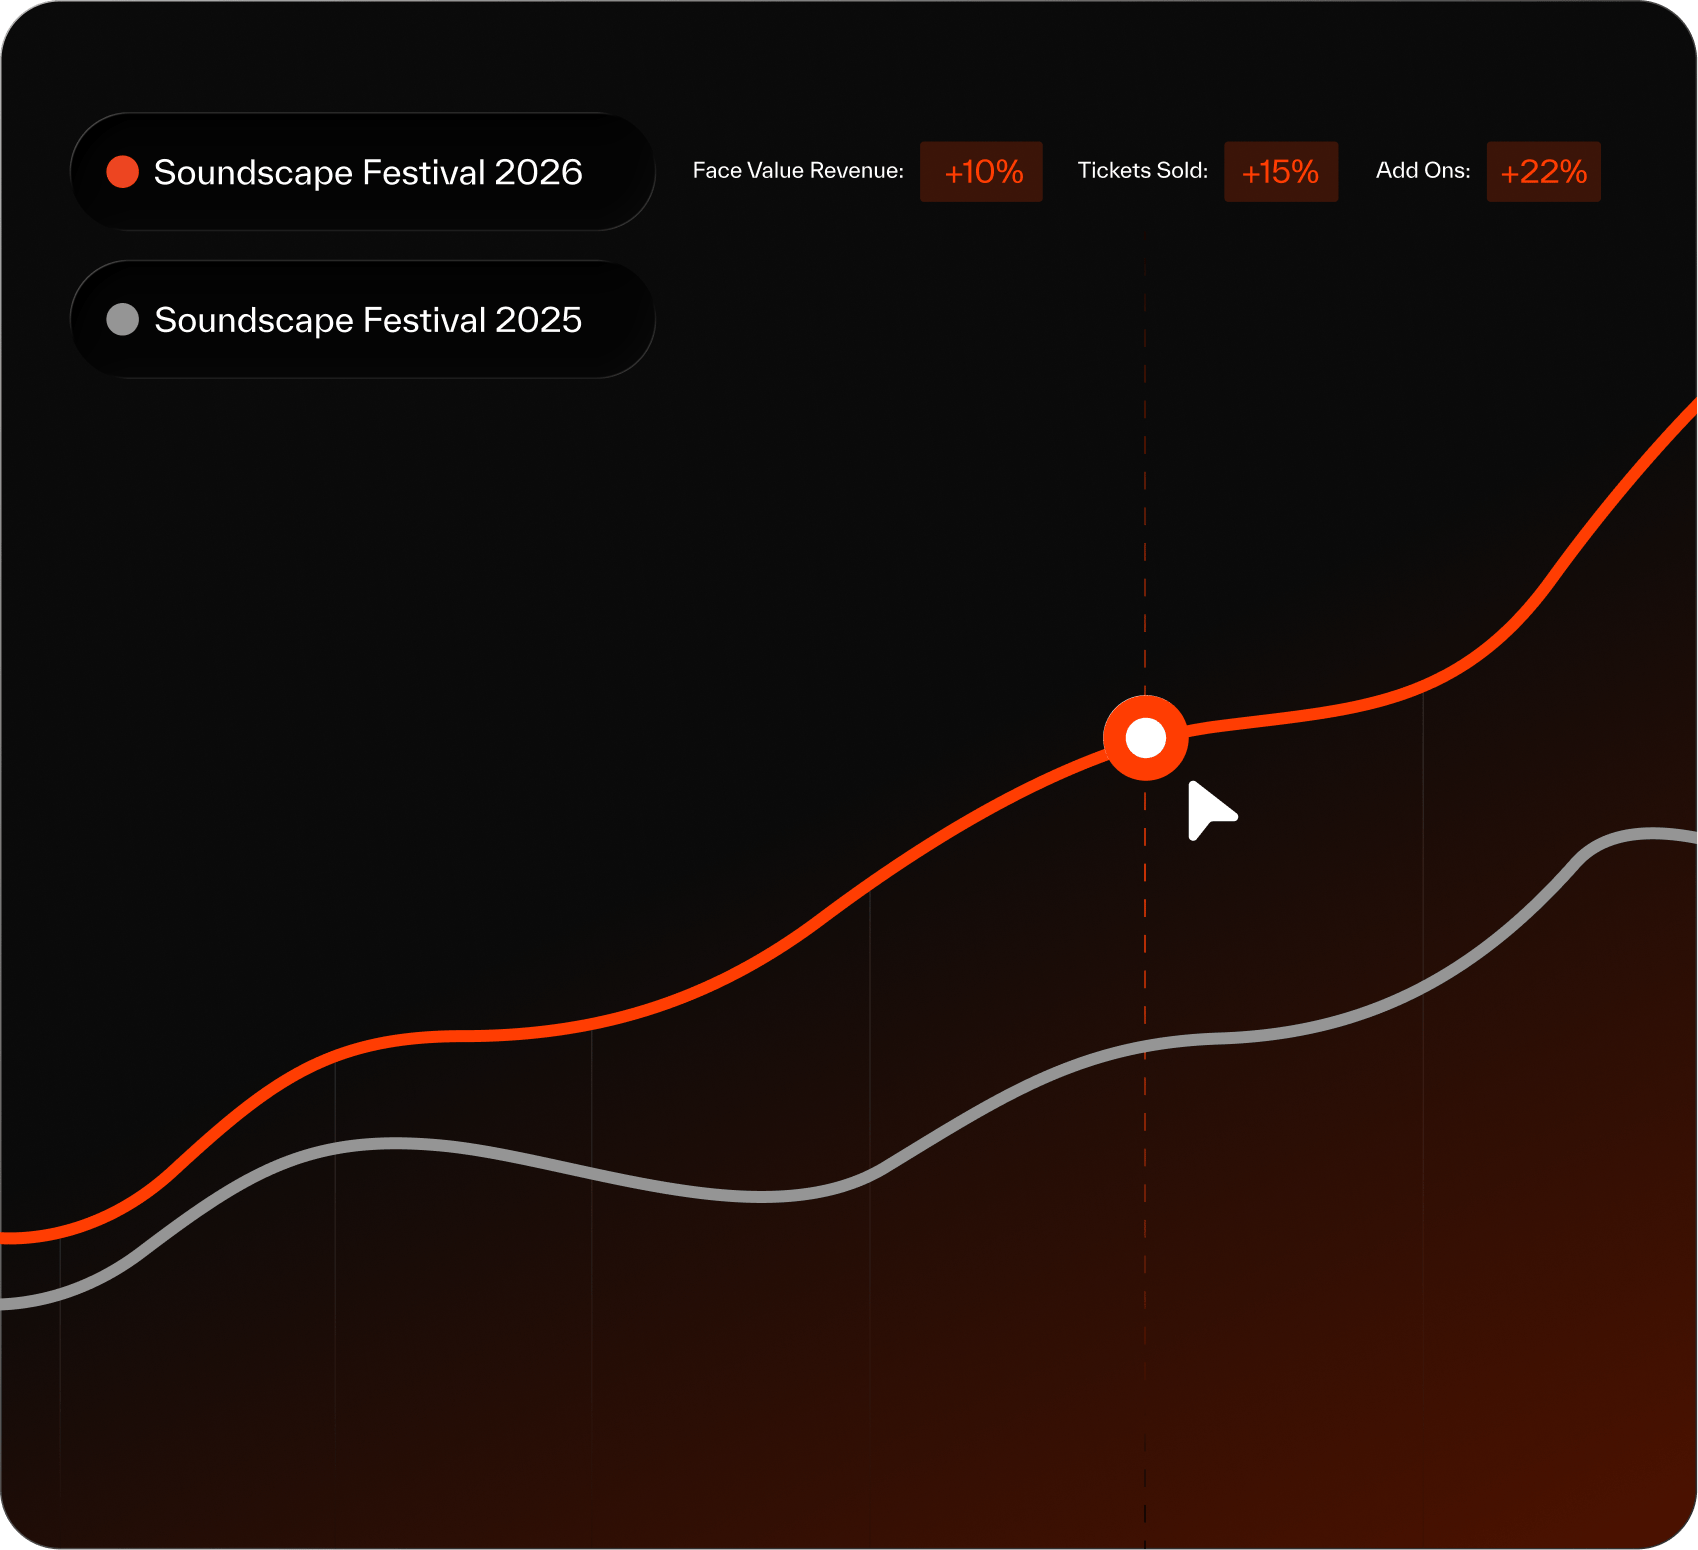
Comparative Sales Reporting
Live dashboards. Live decisions.
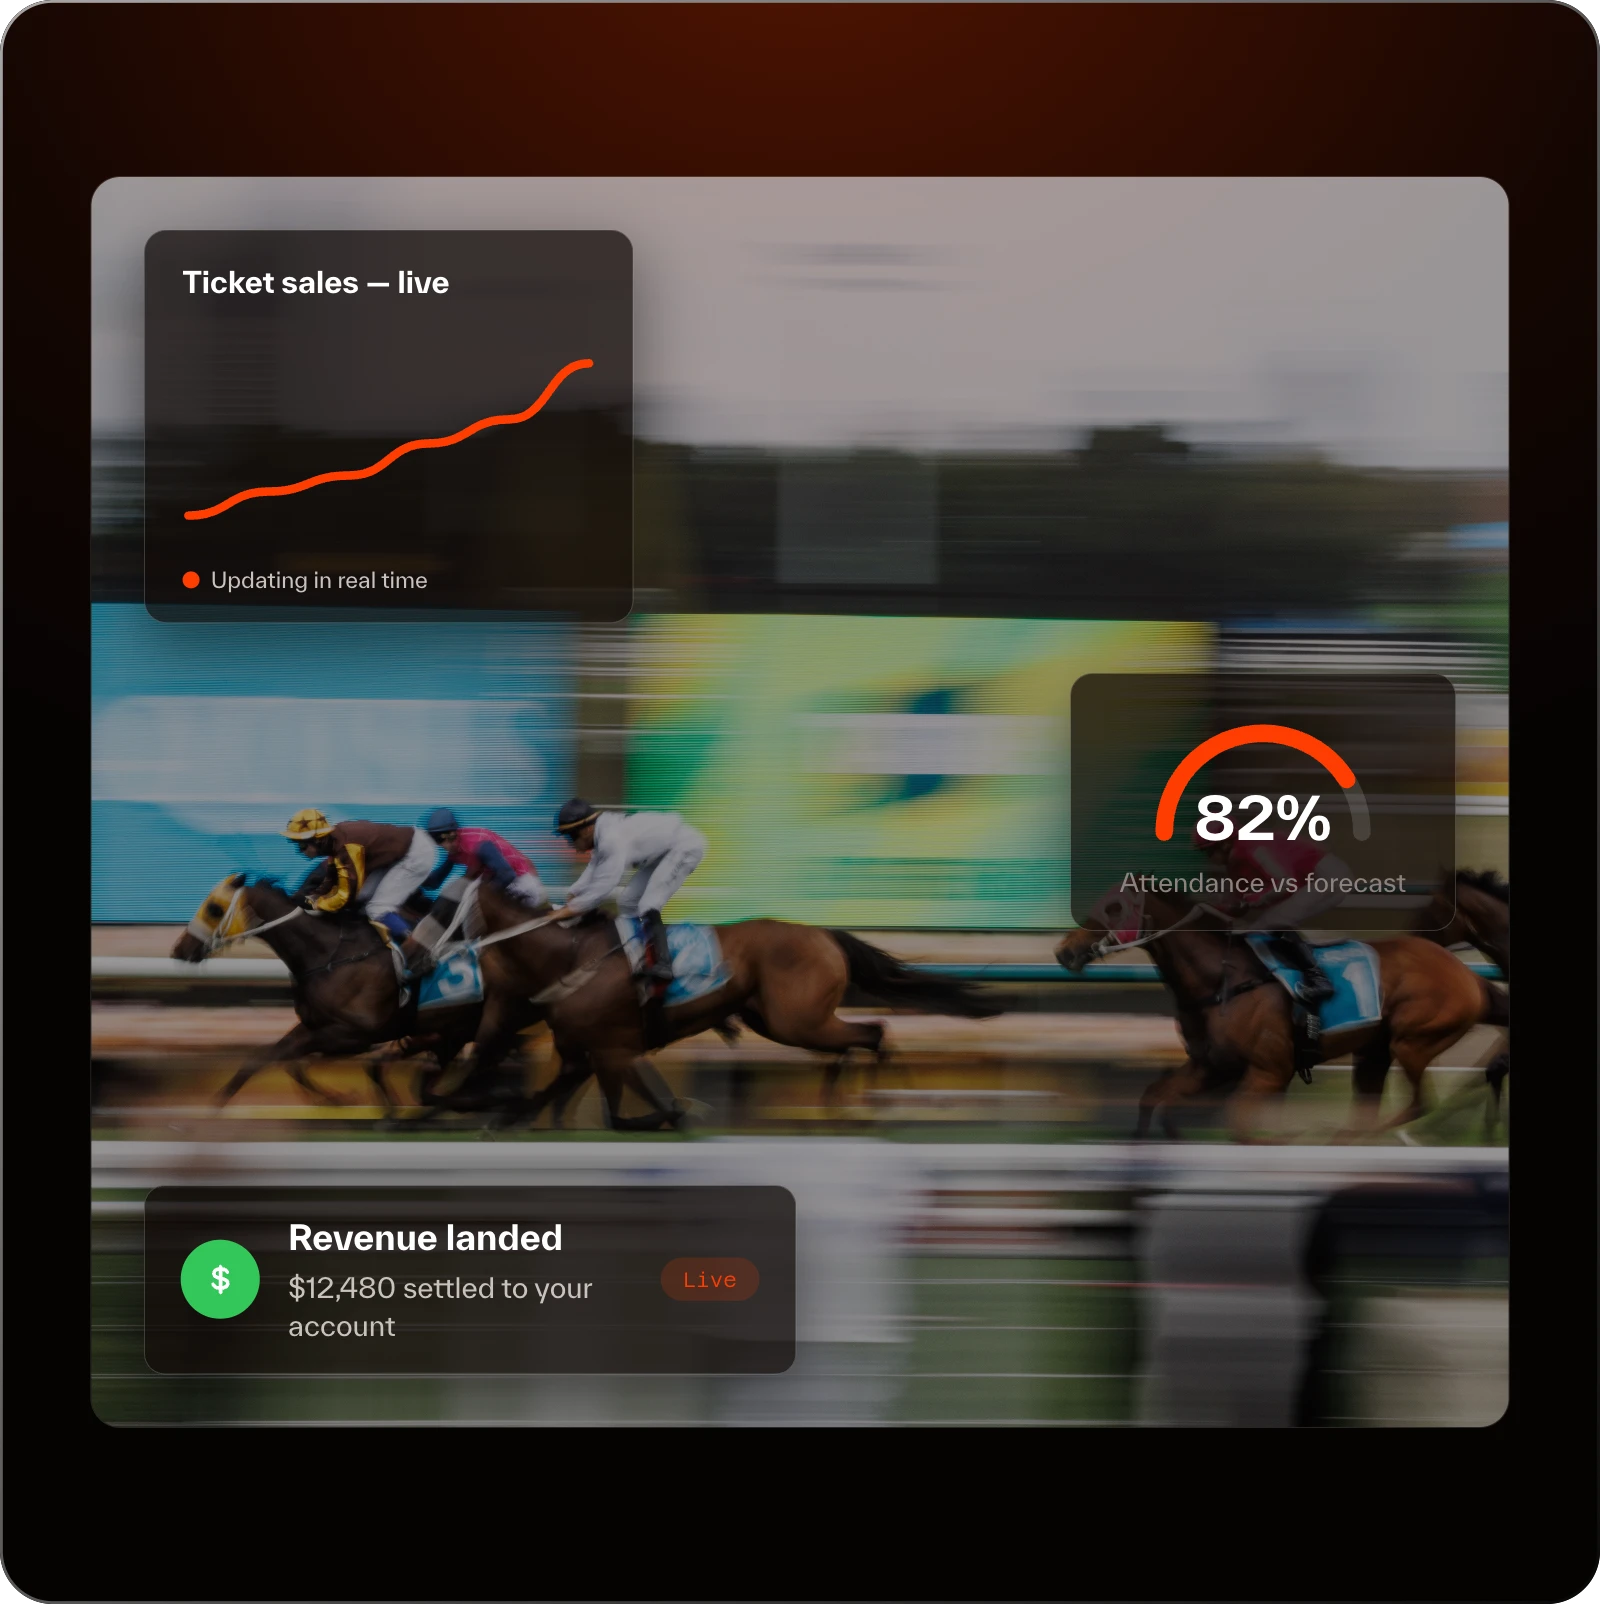
Spreadsheets are the slowest part of any event. Flicket replaces the after-the-fact reconciliation with real-time dashboards that show you what's selling, who's scanning, and what's converting while there's still time to do something about it.
- Real-time sales dashboards
- Live attendance tracking
- Revenue reporting as it lands
- Campaign attribution across channels
- Settlement and financial reporting built in
- Multi-event and multi-venue comparison
Numbers the whole team can read.
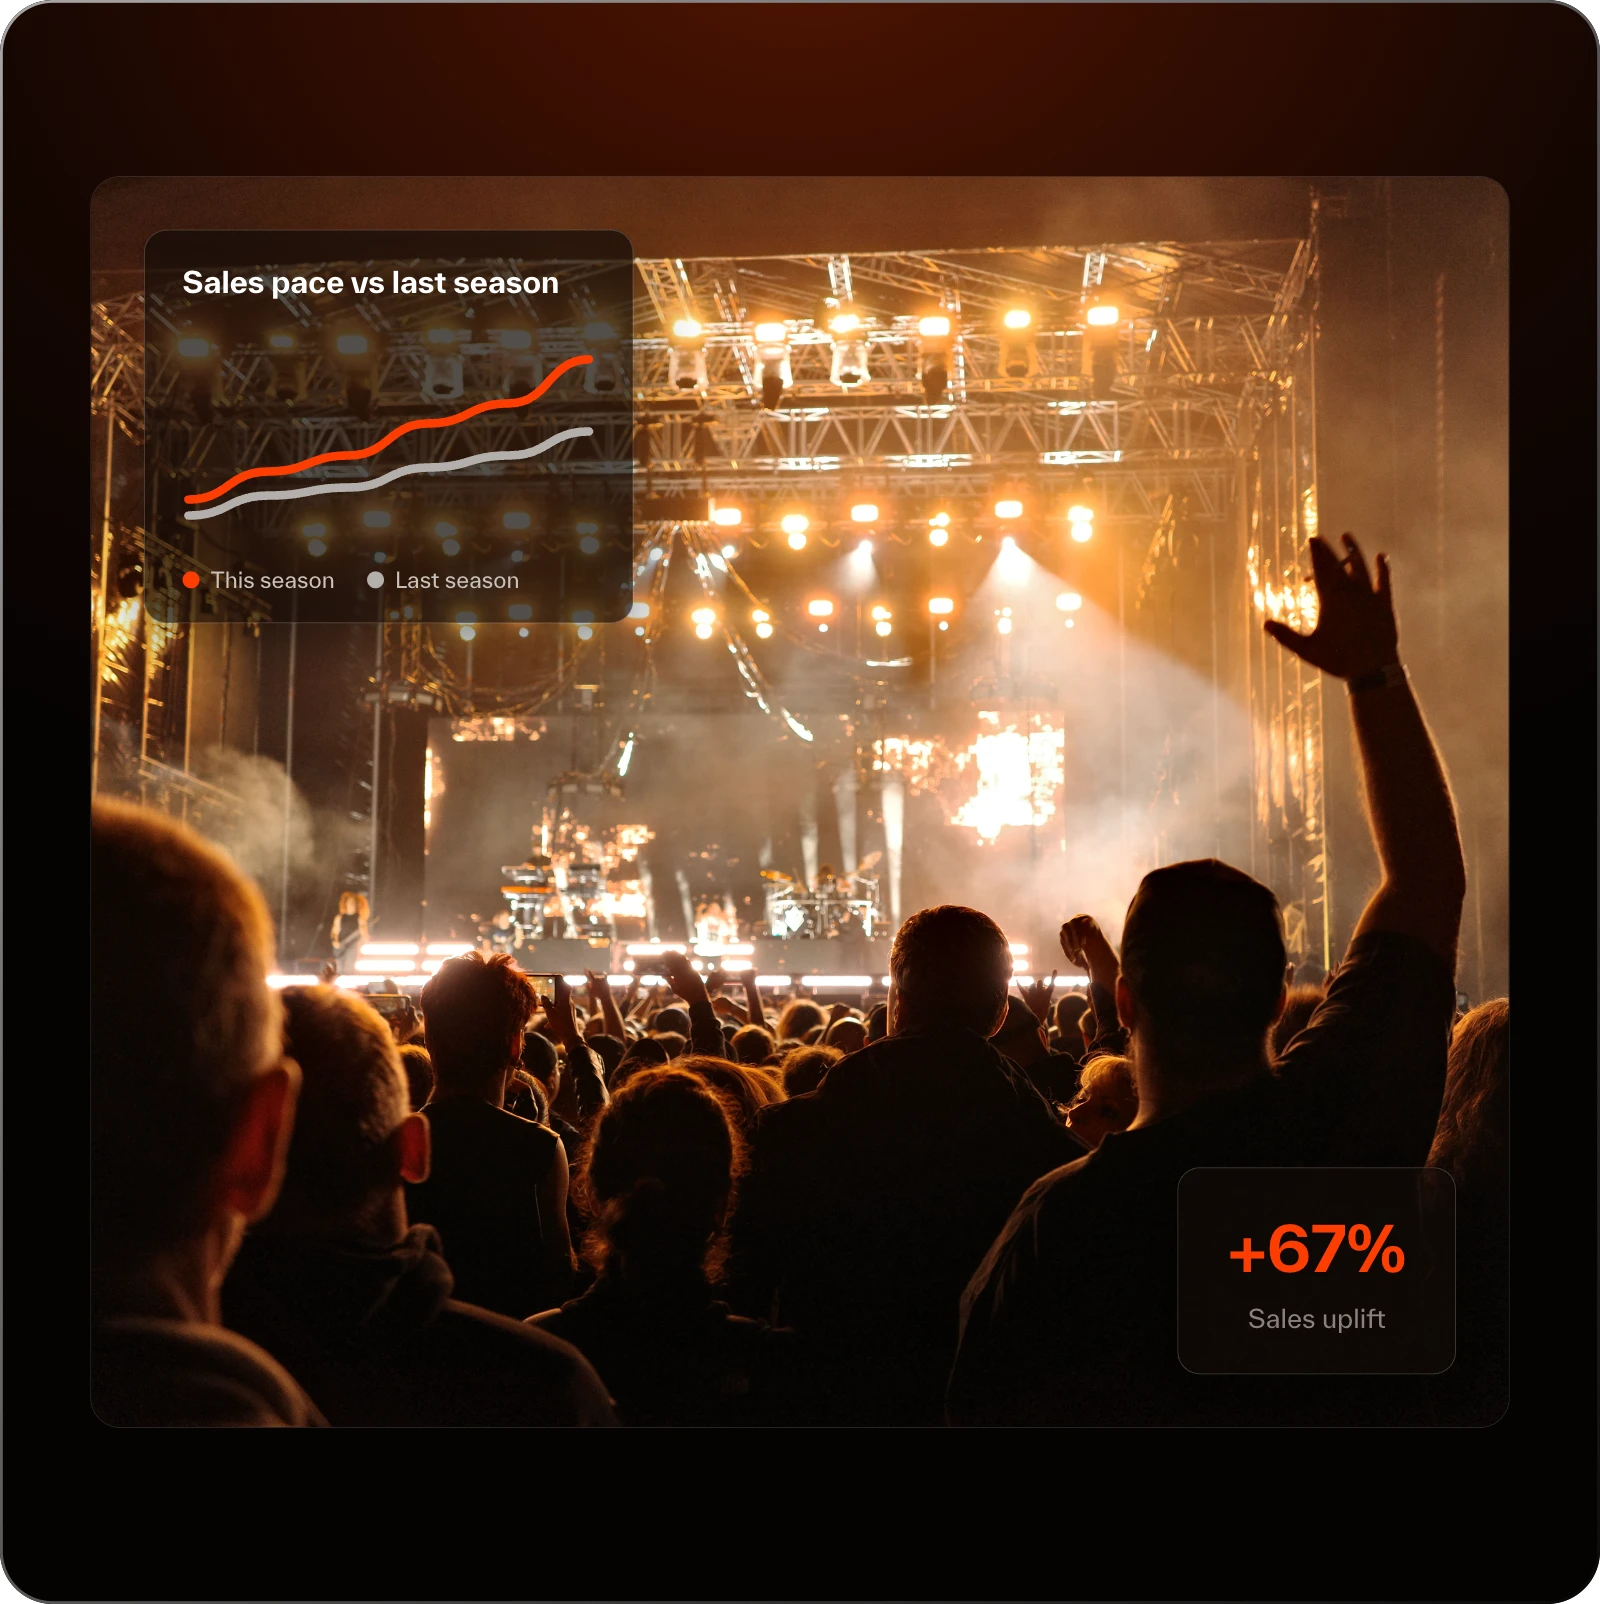
Most reporting tools tell you what already happened. Flicket shows you what's happening, what's working, and what to do about it. Sales pacing, channel performance, attendance versus forecast, revenue per fan are handed to your team in language anyone can read without a finance degree.
- Comparative sales reports across events
- Campaign attribution that ties spend to ticket revenue
- Settlement reporting that matches the books
- Customer value tracked across every interaction
- Exportable reports for finance, sponsors, and stakeholders
Insight that keeps igniting
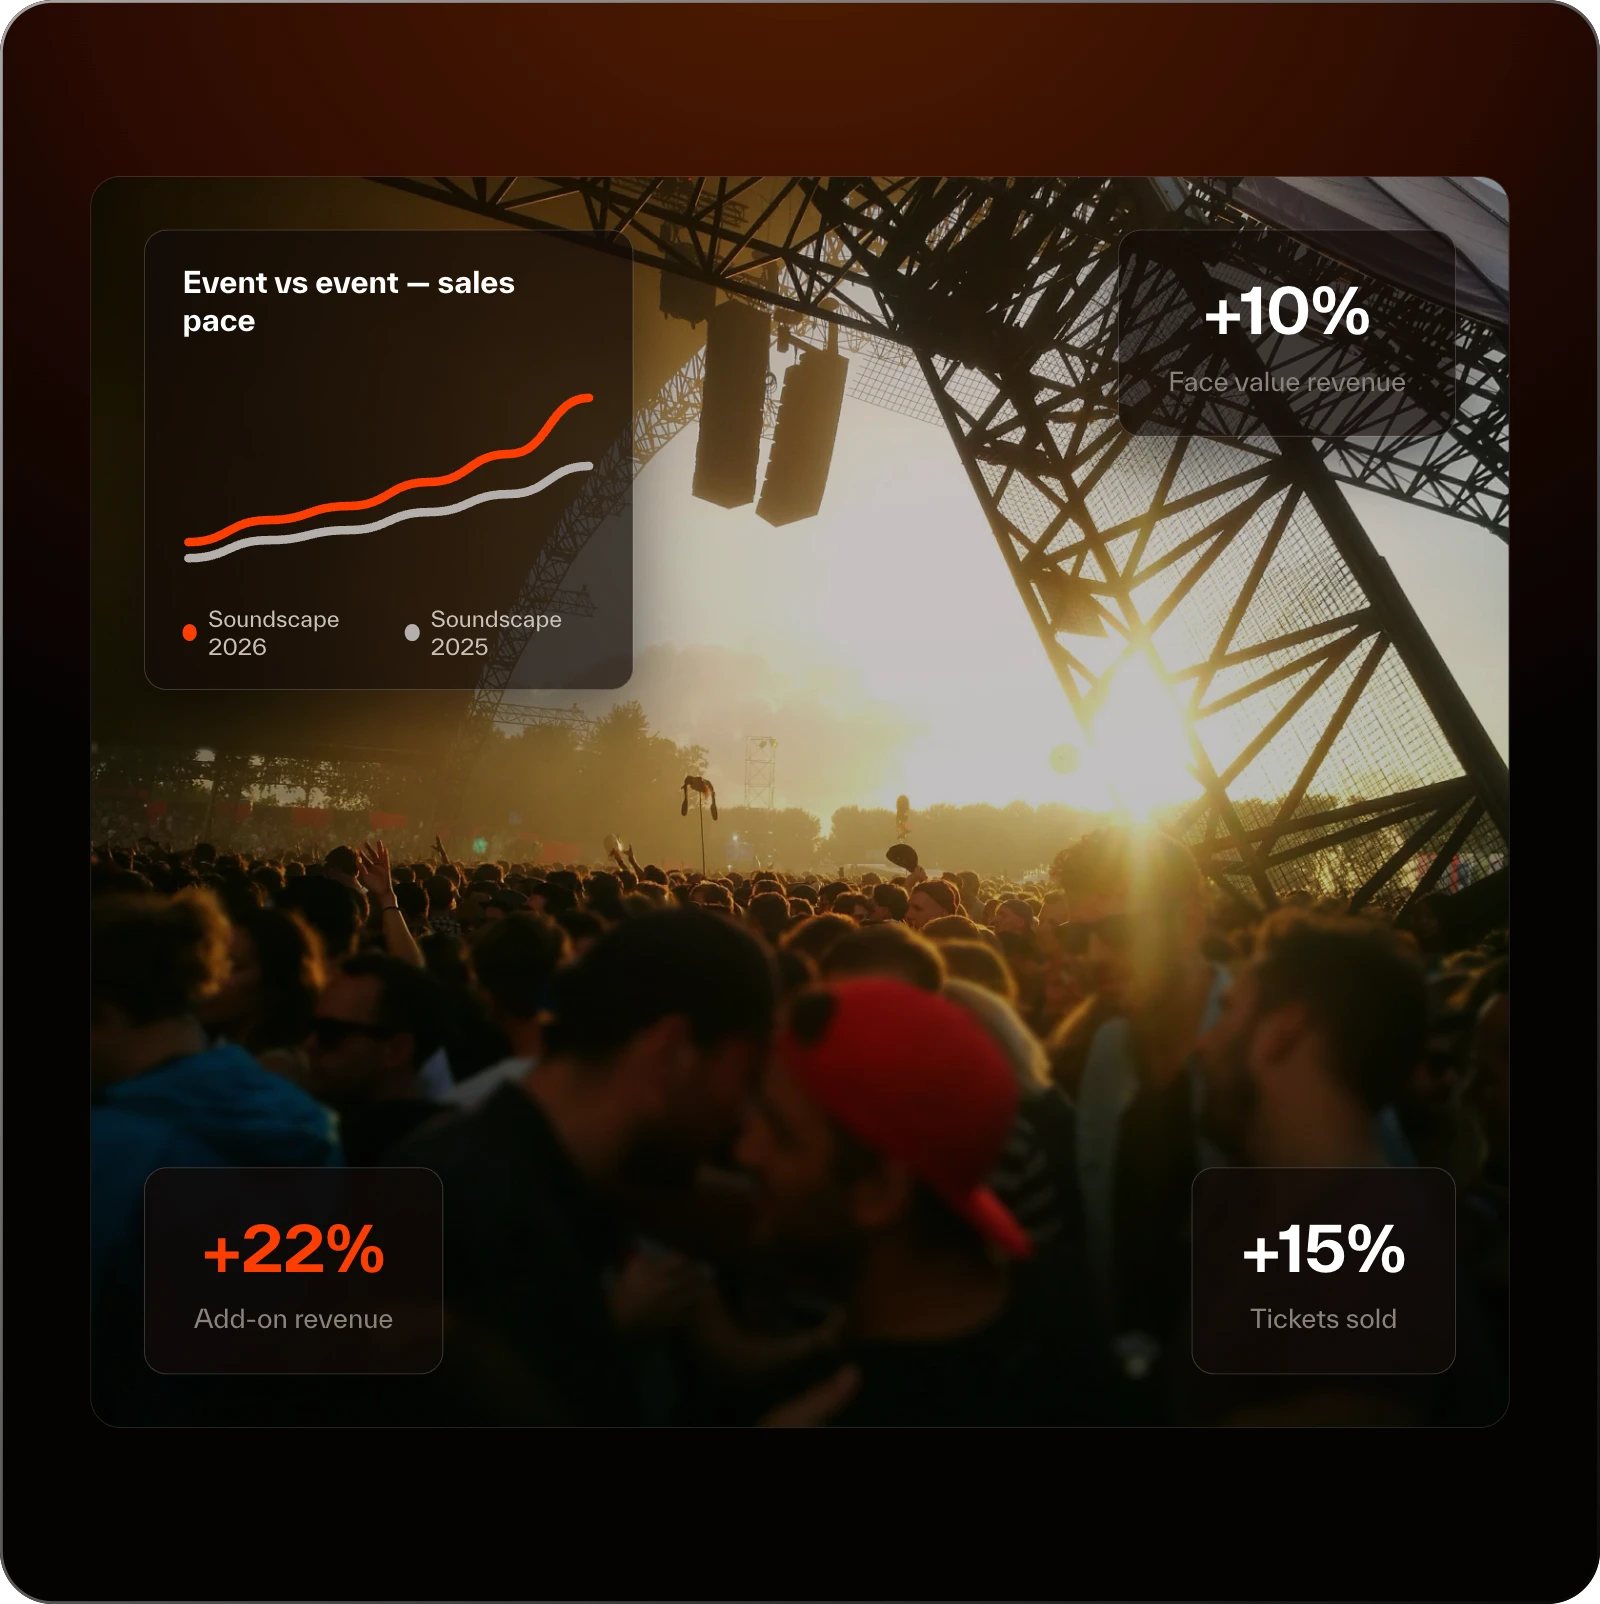
The numbers don't go cold at the end of one event — they fuel the next one. Flicket benchmarks your performance across every event you run, so trends, patterns, and opportunities surface earlier, and the playbook for the next on-sale already knows what worked.
- Side-by-side event comparisons
- Year-on-year and season-on-season tracking
- Sponsor-ready performance summaries
- Audience insight that builds on every event
- Forecasting based on real historical data
Faq
Your burning Reporting questions, answered.
What can I see in Flicket's reporting in real time?

Flicket shows live sales, scan rates, attendance, revenue, and campaign performance in real time as your event runs. The dashboard updates the moment something happens, so there's no waiting for end-of-day exports and no manual reconciliation. You can make decisions while the event is still live rather than after it ends.
Can I compare performance across multiple events?
Yes. Flicket lets you compare sales, attendance, revenue, and campaign performance side by side across events, seasons, and venues. This makes it easy to see what's working, spot trends over time, and adjust your approach for the next event based on real historical data.
Does Flicket handle financial and settlement reporting?
Yes. Settlement and financial reporting are built into the platform, with the level of detail your finance team needs and the format your auditors expect. Financial data is generated automatically from ticket sales and transactions, so there's no exporting to spreadsheets or reconciling between separate systems.
Can I attribute ticket sales to specific marketing campaigns?
Yes. Flicket ties every ticket sold back to the campaign, channel, or source that drove it. This gives you clear marketing attribution, so you can see exactly what your spend is returning and put more behind the campaigns that are actually converting.
Can I share reports with sponsors and stakeholders?
Yes. Flicket lets you build and export performance summaries for sponsors, partners, and internal stakeholders. The reports include the data they care about, such as reach, conversions, and attendance, already pulled together and ready to send, so you're not building decks from scratch.
How does Flicket track revenue and customer value?
Flicket tracks revenue across every transaction and every customer over time. You can see total revenue per event, average spend per customer, and lifetime value across your highest-engaged audiences, which helps you understand where your income comes from and which customers drive the most value.
Do I need a data analyst to use Flicket's reporting?
No. Flicket's reporting is built for the people running the event, not a dedicated data team. The dashboards are clear, the comparisons are visual, and the insights surface automatically, so anyone on your team can read and act on the numbers without writing a query or building a report from raw data.
Flicket
Reporting Stories

